The Friends of Van Cortlandt Park began conducting weekly water quality monitoring at 6 different locations within Tibbetts Brook and Van Cortlandt Lake at the end of December 2015. This work is being done in partnership with various organizations including Bronx Council for Environmental Quality and the USGS who have provided expertise on monitoring and Manhattan College who has assisted with lab analysis of water samples using the lab facilities, students and professors in the School of Engineering. Currently, we are collecting data on the following parameters: Nitrates, Total Phosphorous, pH, Conductivity, Dissolved Oxygen, Discharge, Turbidity and Temperature. If you are interested in learning more about this project (or any of our Wetland Stewardship programs which include restoration and education opportunities) please reach out to our Ecological Project Manager John Butler at john@vancortlandt.org. Here is a quick update from John Butler on some interesting results we have found so far.
Below are two graphs comparing levels of conductivity (microSiemens/cm) and nitrates (mg/L) we have received in the Van Cortlandt Lake system and a pipe that dispenses a constant water flow into the Northwest section of the Lake. The pipes origins are not well known from what information we have gathered, but it is thought to carry water from the northwest section of the Park underneath the Parade Ground and into the Lake. There is drainage in the DOT site within VCP that is thought to drain into this system and it is not known if this pipe has any other sources. We currently estimate the average discharge from this pipe to be approximately 1.06 cfs.
We have also taken note of macroinvertebrates while at each sampling site, and have found very little, compared to other sites, living within the water from the pipe. Also interesting to note, we had found a number of snail shells at this site, but they easily crumbled in the hand. We are interested in looking into this further alongside the possibility of joining the DEC’s WAVE program to report the species found within Tibbetts system to the State.
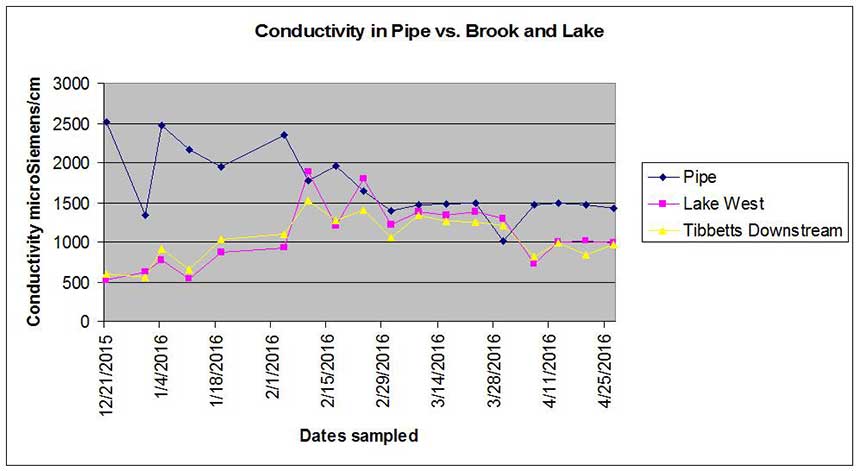
The graph above shows the readings we have received for conductivity from the pipe (40.8939, -73.8908), Lake West site which is essentially the center of the Lake from the western shore (40.8907, -73.8899) and the Tibbetts Downstream site taken from the birding bridge (40.8944, -73.8896). Throughout January and February, the pipes conductivity stayed above 1500 microSiemens/cm and since then have generally stayed just under that mark, whereas readings from the brook and lake have mostly stayed under as well. Taken out of this graph were the readings from 1/27, directly after the large snowstorm of the season. This was to better show the scale of the rest of the dates. On 1/27 the average reading from the pipe that we received was 18,726.7 microSiemens/cm.
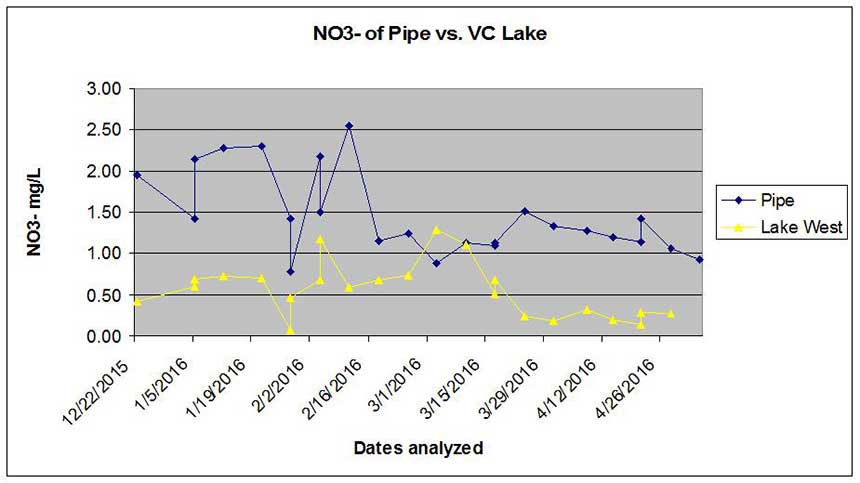
The second graph compares the levels of nitrate from the Lake West site and that of the pipe. When looking at N/P ratios, the pipe is the only site that has P as the limiting factor, and its nitrate levels are generally much higher than that of the rest of the system and Total Phosphorus levels are much lower. The rest of the sites generally have N as the limiting factor, but both nitrate and total Phosphorus levels seem to be high at all brook and lake sites.